Urban Heat Maps and How They Can Improve City Design
Cities face ongoing challenges in designing environments that support sustainability, livability, and resilience. One practical approach to address these challenges is by using Urban Heat Maps. By gathering data from navigation apps and environmental sensors, these maps offer detailed insights into temperature variations and traffic-induced pollution, helping planners create cities that are cooler, greener, and healthier.
Understanding Urban Heat Maps
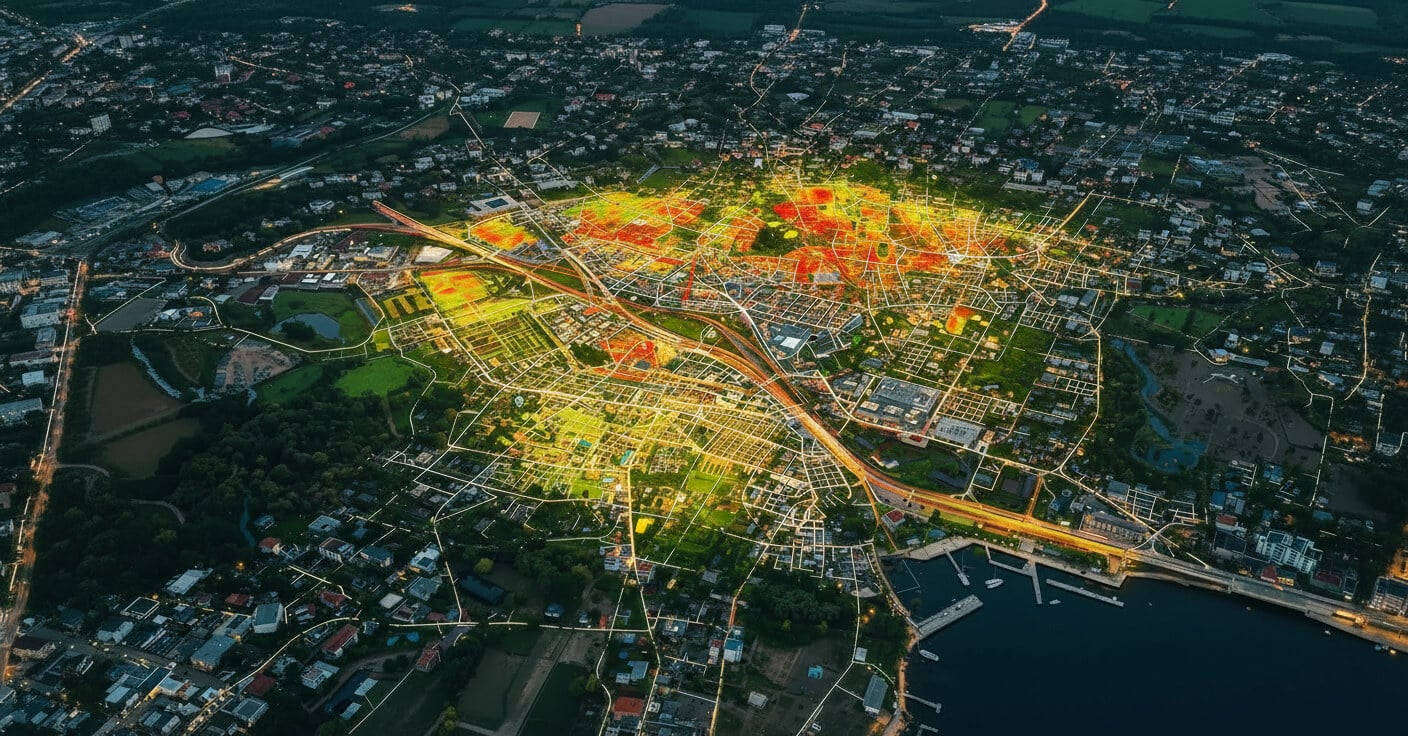
Urban Heat Maps provide visual representations of temperature differences across urban landscapes. Traditionally, city planners relied on fixed weather station reports or satellite imagery. Today, however, integrating real-time data from mobile navigation applications has made it possible to capture minute details about local temperatures and congestion. This detailed mapping enables officials to spot micro-climates and heat islands that may be the result of traffic, construction, and densely built environments.
These maps reveal areas with higher temperature readings that often correlate with heavy traffic and concentrated human activity. When city designers review Urban Heat Maps, they can better understand which parts of the city are most affected by heat buildup. This understanding is crucial in prioritizing interventions, such as planting trees, designing water features, or even rethinking road networks.
The Role of Real-Time Data from Navigation Apps
One key element behind modern Urban Heat Maps is the influx of real-time data from navigation apps. Every day, these apps collect large amounts of information on vehicle speeds, travel patterns, and congestion points. This data, when combined with temperature and environmental readings, creates a dynamic view of the city’s heat profile.
For example, a busy intersection that regularly experiences heavy traffic might show a clear temperature spike during rush hours. With this knowledge, city officials can target these specific areas for interventions such as improved public transit, alternate routing, or the development of green corridors. In this way, Urban Heat Maps not only expose problematic zones but also help shape practical, localized solutions.
Enhancing City Design Through Data-Driven Insights
City design today must be guided by actionable data, and Urban Heat Maps serve as one of the best sources of that information. Planners can use these maps to pinpoint neighborhoods that experience excessive heat and pollution. From this analysis, several strategies emerge:
Expansion of Green Spaces
Areas flagged by Urban Heat Maps as excessively warm can be prioritized for the creation of parks, urban forests, and community gardens. Vegetation helps lower local temperatures by providing shade and increasing moisture through transpiration.
Sustainable Infrastructure
With the insights provided by Urban Heat Maps, designers can select materials and techniques that reduce heat absorption. For instance, using lighter-colored paving materials and reflective surfaces in hotspot areas can significantly mitigate heat buildup.
Improved Transportation Networks
Traffic congestion contributes to localized heating and increased pollution. By studying Urban Heat Maps, city planners can adjust transit routes and improve public transportation options. Reduced reliance on individual vehicles helps lower overall emissions, benefiting both temperature control and air quality.
Integration with Smart City Systems
Urban Heat Maps can be integrated into broader smart city frameworks. This integration allows for continuous monitoring and swift responses to changing conditions, from managing sudden heat spikes to coordinating emergency services during extreme weather events.
実際の応用と事例研究
Cities around the globe have begun to implement Urban Heat Maps as part of their urban planning initiatives. In one metropolitan area, the use of navigation app data led to the creation of detailed heat maps, revealing that several busy intersections consistently recorded higher temperatures. In response, city planners enhanced green infrastructure and reconfigured traffic patterns to improve air flow.
Similarly, another urban center used Urban Heat Maps to assess areas most vulnerable during heat waves. By pinpointing these zones, officials set up cooling centers and adjusted emergency plans to better serve affected residents. These case studies demonstrate that accurate mapping of urban heat can drive informed decisions, ultimately creating environments that are better prepared to face climatic stresses.
The Future of Urban Design with Urban Heat Maps
Looking forward, the evolution of Urban Heat Maps is likely to further refine city planning. As more data becomes available from mobile devices and sensor networks, these maps will grow increasingly precise. Advanced analytics and machine learning will enable planners to predict how changes, such as the introduction of new public transit routes or the development of green spaces, will affect local climates.
Future systems may even combine Urban Heat Maps with other urban indicators, such as noise pollution or pedestrian traffic, to provide a comprehensive picture of urban life. These integrated systems can support proactive planning, ensuring that cities are designed with long-term sustainability and public well-being in mind.
Addressing Challenges and Data Integrity
While the advantages of Urban Heat Maps are significant, challenges remain. The reliability of these maps depends on the quality and coverage of data collected from navigation apps and sensors. In some areas, sparse data can lead to incomplete maps, making it essential to continuously upgrade and maintain the data collection network.
Additionally, data privacy is a key concern. It is crucial to handle all user data with care, ensuring that any information collected is anonymized and secure. This balance between obtaining valuable insights and protecting individual privacy is critical for the ongoing success of Urban Heat Maps initiatives.
結論
Urban Heat Maps provide a new lens through which city planners can view and address the complex challenges of urban living. By combining real-time data from navigation apps with environmental monitoring, these maps reveal critical insights about localized heat patterns and pollution levels. The detailed information supports targeted interventions—from expanding green spaces and upgrading infrastructure to optimizing public transportation and enhancing overall urban design.
With the pressures of climate change and urban growth intensifying, the data-driven approach offered by Urban Heat Maps is increasingly valuable. Planners are now equipped with the tools needed to identify high-risk areas and implement measures that not only mitigate heat accumulation but also improve the quality of life for residents.
As cities continue to transform, Urban Heat Maps will play an essential role in guiding these changes, ensuring that urban environments are built on principles of sustainability, efficiency, and resilience. By adopting this practical approach, urban planners can create spaces that are cooler, greener, and more responsive to the needs of a modern society.
The continued advancement of mapping technologies and the increasing availability of real-time data promise to further enhance the effectiveness of Urban Heat Maps. In the coming years, as cities adapt to changing environmental conditions, these maps will remain a cornerstone of forward-thinking urban design, helping to build cities that are both sustainable and livable for generations to come.